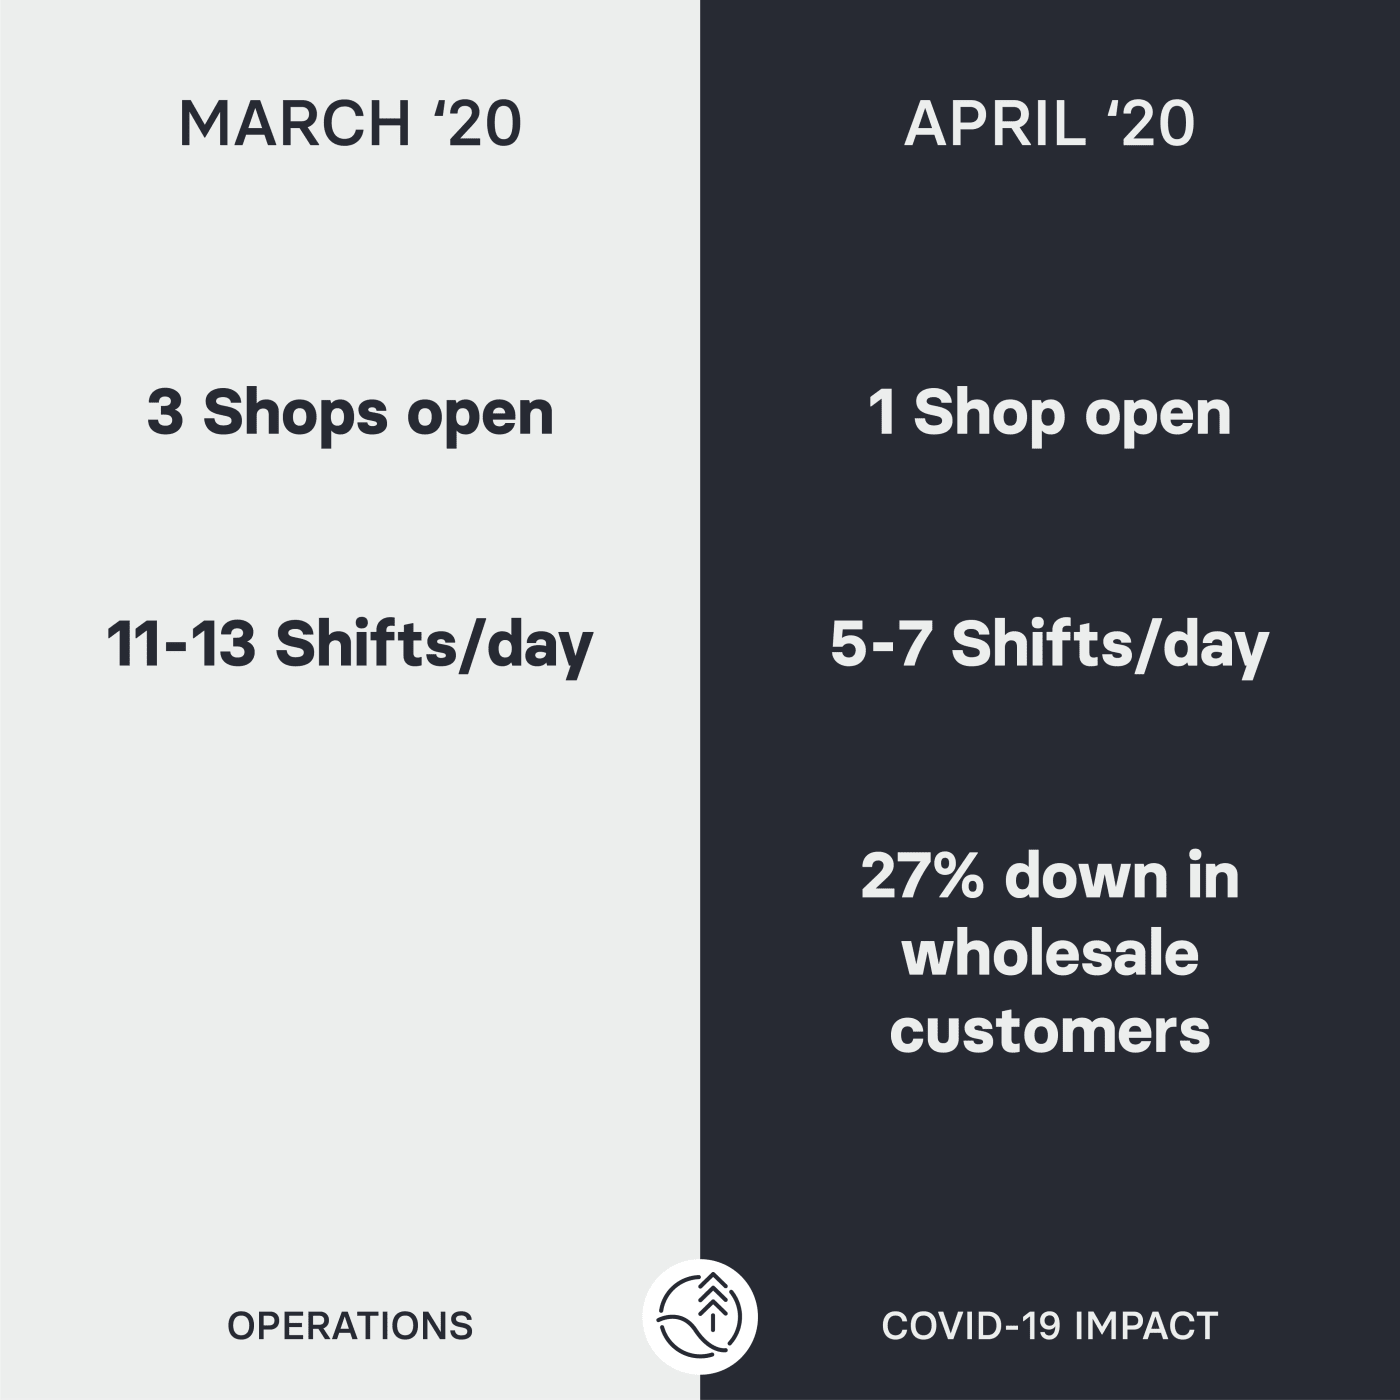
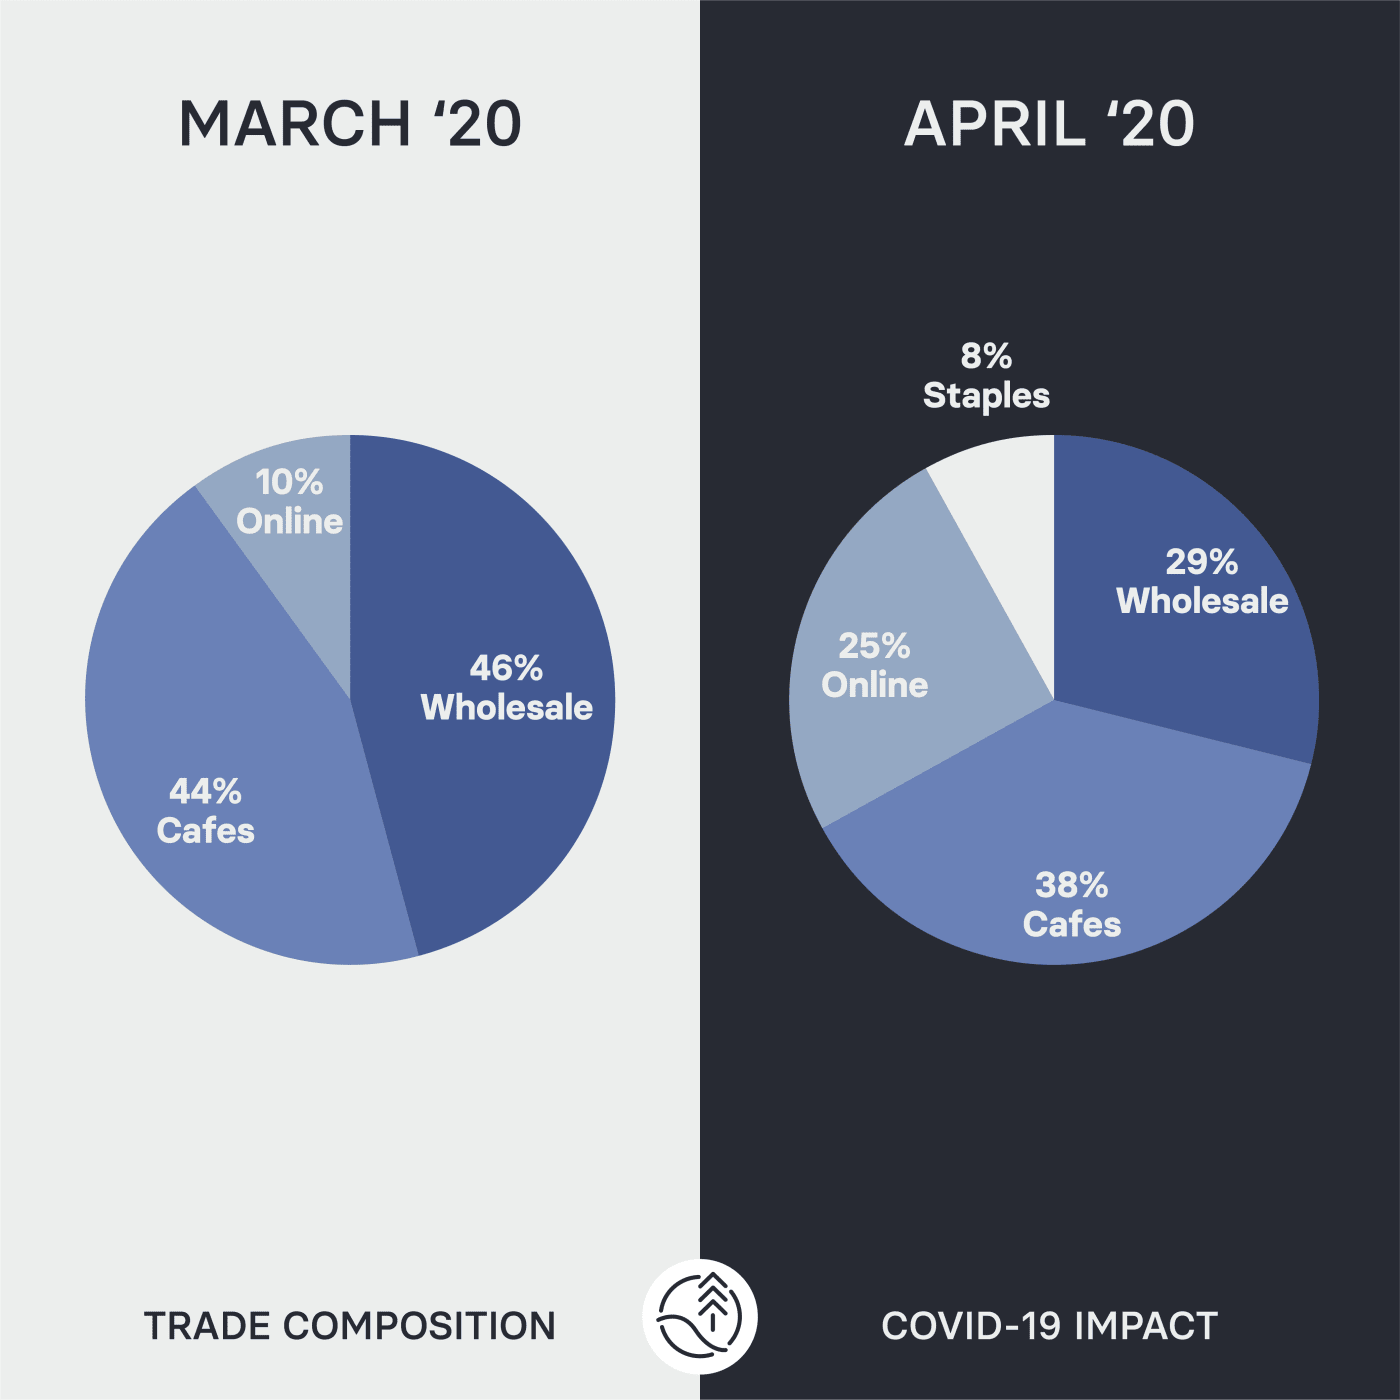
We knew this “Covid season” changed us, but wanted to look at the numbers to get the true scope of it. Took the first 10 days of March and April and compared a few stats. Look at the slides below and judge yourself. Pretty crazy.
Something unable to be quantified: the amount of collaboration between hospitality mates; the understanding, creativity and drive of our team; and the support from old and new customers.